Page 111 - JRCERT Update Articles
P. 111

JRCERT Update

          Visualization in Data Analysis


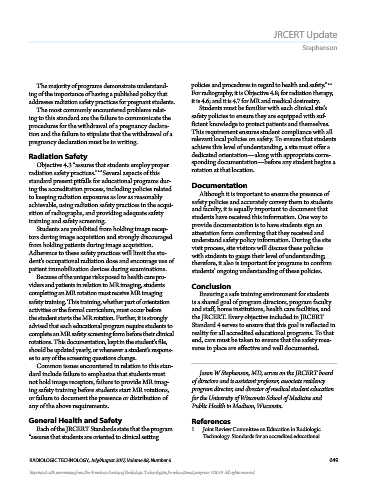
          However, data can be manipulated in various ways,    A
                                           16.5%
          so it often is valuable to use more than 1 visualization
                                 32%
          technique to give a complete and accurate picture of the
                                               26.5%
          information.                                                                 16.5%
                                     25%
          Pie Charts                                                       32%
            A pie chart best communicates data that can be
          shown in a simple image to represent parts of a whole.                          26.5%
                                          Image Production
                             Patient Care
          It is used to visualize nominal, descriptive categories,
                             Safety
                                          Procedures
          such as demographic information, or ordinal catego-                  25%
          ries, such as ranked survey data. Pie charts are most
          appropriate for displaying data split into 6 categories or
          fewer.  When there are more categories, it is difficult to
               3
                                  ARRT First Attempt Pass Rate
          distinguish between the relative sizes of the different        Patient Care  Image Production
                       110
          sections, and the chart is difficult to interpret. Three-      Safety       Procedures
                       First Attempt Pass Rate 100
                        90
          dimensional pie charts also are difficult to interpret as
                        80
                        70
          they can visually distort information (see Figure 1).
                        60
          Notice how the section showing image production,
                        50
                        40
          which makes up 25.5% of the entire exam (or 50 out of   B                   16.5%
                        30
                        20
          200 total questions), appears as large or larger than the         32%
                        10
                        0
          Safety section, which makes up 26.5% (or 53 out of 200   2016                   26.5%
                                                  2015
                                   2013
                                          2014
                           2012
                                         Year
          total questions). This illusion occurs because adding                 25%                                               16.5%
          a third dimension distorts the perception of the slices'                                                     32%
          relative sizes.         Patient Care Student Learning
                                  Outcome Benchmark Score 2.5
                                                                                 ARRT Scores
                        4                                                        2013-2016
          Column Charts    2.7  2.8  2.7  2.7  2.8  2.8  2.7  2.65  2.7  89                                                          26.5%
                       Learning Outcome Score
                       3.5
                        3
            A column chart can show changes in categorical data   88     Patient Care  Image Production
                                                                  87
                       2.5
          sets over time, or longitudinally. This long-term analysis   Average ARRT Test Scores  86  Safety  Procedures   25%
                                                                  85
                        2
          allows educators to base decisions on trends rather than   84
                       1.5
                                                                  83
                                                                  82
                        1
          data from outliers. The x-axis generally shows indepen-  Figure 1. Pie charts showing American Registry of Radiologic
                                                                  81
                       0.5
                                                                  80gists (ARRT) radiography examination sections. The 2-D
          dent variables, or variables that the educator can choose   Technolo  2013  2014  2015  2016
                        0
                               2015
                                                                             ARRT First Attempt Pass Rate
                                                  2010
                                      2013
                                  2014
                                              2011
                                          2012
                           2016
          or control (eg, a year), and the y-axis shows dependent  2009  2008 pie chart (A) depicts the proportion of test questions more accurately   Patient Care  Image Production
                                                                                    Year
                                        Year
                                                             than the 3-D pie chart (B), which distort
                                                                                   Programs the information. Figures
                                                                          National
                                                                  110
          variables, or the variables that the educator wants to mea-  courtesy of the author.  State               Safety       Procedures
          sure (eg, ARRT exam scores for each graduating class). It   90
                                                                   80
                           Average ARRT Scores vs Average HS Math Scores
          is extremely important to review the scale of the y-axis to   70
                                                                   60
                       4.5
          avoid misrepresenting differences between data sets. For   First Attempt Pass Rate 100  ARRT Exam Scores
                                                                   50
                                                                                 2013-2016
                        4
                                                                   40
          example, the charts in Figure 2 were created using the   illustrate whether students are meeting or exceeding a
                                                                   30
                       3.5
                       ARRT Exam Scores
                                                                 100
                                                                   20
                        3
          same data and show average ARRT scores grouped at the   benchmark over time, which can help educators make
                                                                   10
                                                                  80
                                                                    0
                       2.5
          national, state, and program levels, which is an excellent   decisions about adjusting the target (see Figure 4).
                                                                                                    2016
                                                                      2012
                                                                                      2014
                                                                                             2015
                                                                              2013
                                                                  60
                        2
                                                                                    Year
          tool for benchmarking. Scaling inconsistency distorts the   Average ARRT Test Scores  40
                       1.5
                        1
          information and misrepresents the data.            Scatter Plot Charts
                                                                  20
                                                                             Patient Care Student Learning
                       0.5
            Adding a trend line or a benchmark line to a col-   A scatter plot chart shows the relationship between 2
                                                                   0
                                                                             Outcome Benchmark Score 2.5
                        0
                                                                                2014
                                                                       2013
                                                                                        2015
                                                                                                 2016
                         0
                                20
                                       40
                                              60
          umn chart can assist with better visualization of   80  100  variables or reveals distribution trends. The scatter plot   ARRT Scores
                                                                                    Year
                                                                                                                            2013-2016
                                                                    4
                                                                                            State
                                    High School Math Scores
                                                                                   Program
                                                                          National
                                                                  Learning Outcome Score
          subtle trends, whether they are positive or negative   shows a positive relationship between high school math   89
                                                                   3.5
                                                                              2.7
                                                                                  2.7
                                                                                          2.8
                                                                                      2.8
                                                                                                     2.7
                                                                                                 2.65
                                                                                              2.7
                                                                       2.7
                                                                          2.8
                                                                                                             88
                                                                    3
          (see Figure 3). The addition of a benchmark line can   grades and higher ARRT average scores (see Figure 5).  Average ARRT Test Scores  87
                                                                   2.5
                                                                                                             86
                                                                    2
                                                                                                             85
                                                                                                             84
                                                                   1.5
                                                                                                             82
                                                                    1
                                                                                                             81
          80                                              RADIOLOGIC TECHNOLOGY, September/October 2017, Volume 89, Number 1  83
                                                                   0.5
                                                                    0                                        80   2013     2014     2015    2016
                                                                      2016  2015  2014  2013  2012  2011  2010  2009  2008
          Reprinted with permission from the American Society of Radiologic Technologists for educational purposes. ©2019. All rights reserved.  Year
                                                                                    Year
                                                                                                                      National  Program  State
                                                                       Average ARRT Scores vs Average HS Math Scores
                                                                   4.5                                                    ARRT Exam Scores
                                                                    4                                        100            2013-2016
                                                                  ARRT Exam Scores  2.5 3 2                 Average ARRT Test Scores  80
                                                                   3.5
                                                                                                             60
                                                                   1.5
                                                                                                             40
                                                                   0.5 1                                     20
                                                                    0                                         0   2013     2014     2015    2016
                                                                     0     20     40     60     80    100                      Year
                                                                               High School Math Scores                National  Program  State
   106   107   108   109   110   111   112   113   114   115   116