Page 74 - Radiation Therapy Flipbook
P. 74

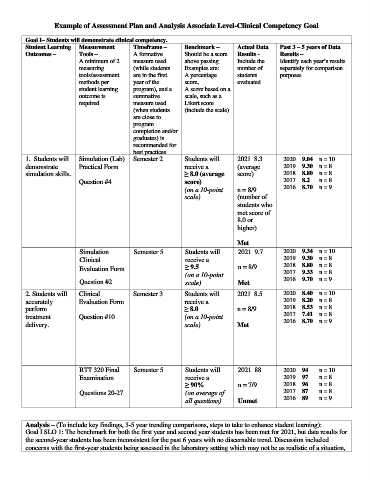
Example of Assessment Plan and Analysis Associate Level-Clinical Competency Goal


         Goal I– Students will demonstrate clinical competency.
         Student Learning   Measurement      Timeframe –      Benchmark –      Actual Data   Past 3 – 5 years of Data
         Outcomes –        Tools –           A formative      Should be a score   Results -   Results –
                           A minimum of 2    measure used     above passing.    Include the   Identify each year’s results
                           measuring         (while students   Examples are:   number of     separately for comparison
                           tools/assessment   are in the first   A percentage   students     purposes.
                           methods per       year of the      score,           evaluated
                           student learning   program), and a   A score based on a
                           outcome is        summative        scale, such as a
                           required.         measure used     Likert score
                                             (when students   (include the scale)
                                             are close to
                                             program
                                             completion and/or
                                             graduates) is
                                             recommended for
                                             best practices.
         1. Students will  Simulation (Lab)   Semester 2      Students will    2021  8.3      2020  9.04  n = 10
         demonstrate       Practical Form                     receive a        (average       2019  9.30  n = 8
         simulation skills.                                   ≥ 8.0 (average   score)         2018  8.80  n = 8
                           Question #4                        score)                          2017  8.2   n = 8
                                                              (on a 10-point   n = 8/9        2016  8.70  n = 9
                                                              scale)           (number of
                                                                               students who
                                                                               met score of
                                                                               8.0 or
                                                                               higher)

                                                                               Met
                           Simulation        Semester 5       Students will    2021  9.7      2020  9.34  n = 10
                           Clinical                           receive a                       2019  9.30  n = 8
                           Evaluation Form                    ≥ 9.5            n = 8/9        2018  8.80  n = 8
                                                              (on a 10-point                  2017  9.33  n = 8
                           Question #2                        scale)           Met            2016  9.70  n = 9

         2. Students will  Clinical          Semester 3       Students will    2021  8.5      2020  8.40  n = 10
         accurately        Evaluation Form                    receive a                       2019  8.20  n = 8
         perform                                              ≥ 8.0            n = 8/9        2018  8.53  n = 8
         treatment         Question #10                       (on a 10-point                  2017  7.41  n = 8
         delivery.                                            scale)           Met            2016  8.70  n = 9


                           RTT 320 Final     Semester 5       Students will    2021  88       2020  94    n = 10
                           Examination                        receive a                       2019  97    n = 8
                                                              ≥ 90%            n = 7/9        2018  96    n = 8
                           Questions 20-27                    (on average of                  2017  87    n = 8
                                                              all questions)   Unmet          2016  89    n = 9


         Analysis – (To include key findings, 3-5 year trending comparisons, steps to take to enhance student learning):
         Goal I SLO 1: The benchmark for both the first year and second year students has been met for 2021, but data results for
         the second-year students has been inconsistent for the past 6 years with no discernable trend. Discussion included
         concerns with the first-year students being assessed in the laboratory setting which may not be as realistic of a situation,
   69   70   71   72   73   74   75   76   77   78   79